March 2020. This will be a month that our generation will remember for our entire lives. The Dow Jones, the DAX, the HSI, the Nikkei and almost every major world Index has dropped between 20- 35% in a matter of 30 days sending the world into a financial tail spin. The main reasons being attributed to the COVID-19 Pandemic and to a lesser extent (at least from a media perspective) the oil crash sending crude to an 18 year low.
COVID-19 has resulted in many countries closing their borders, minimizing global trade, asking citizens to stay home and for lack of a better word not to participate in the economy. This, of course, is for the greater good of the populations health and safety but has a devastating affect on the economy and the fear and uncertainty has a direct impact on the open markets valuation of companies that are otherwise healthy. This is akin to being on a production line and hitting the emergency break. Everything comes to a screeching halt and once everything is inspected and deemed good to go the starting back up is much slower than the time it took to take it down. Even if it just takes 5 seconds to shut it down and 30 seconds to get it back up it is still 6 times longer. Let that sink in. The recovery won’t be quick but it is inevitable.
Now to focus on the positive side, as my dad has always said “Where there is sh*t there is opportunity”. This is a chance for long term investing oriented people to get into a stock market that has been on a bull run for the last 11 years and has made finding growth investments difficult. There is a huge mental block that comes with a huge selloff and trying to convince yourself to buy into a market that is a sea of red for 30+ days so let’s use the last financial crisis in recent history to simulate the idea of buying in even when everything is going down. It is important to remember it is not what you do well once but rather what you do consistently that determines your long term success. This sentiment applies to many things (diets, learning a new skill, career progression, sports etc.) but we are going to focus on how consistently investing during in good times is rewarded.
2008 Financial Crisis
There is more than enough literature out there for you to educate on the causes of the global financial crisis so we will not focus on that here. All that you need to know is that the Dow Jones fell from its all time high of 14,065 on October 2017 to 6,626 by February 2019. That is a drop of 52% over 17 months. That is a very scary thing to see happen to your hard earned money and investments being slashed in half. That being said the recovery is much quicker for investors who continued to invest throughout the downturn and continued once the fortunes of the market turned positive again. Let’s review both scenarios, lets say Mary and Sarah, and compare the two. First lets make some assumptions:
- In both scenarios both Mary and Sarah invested their initial investments of $100,000.00 at the peak of the market
- Mary continues to invest consistently each month an additional $1000.00
- Sarah stops investing at the 2007 peak and just waits for the market to recover
- Both Mary and Sarah are invested in Dow Jones index fund
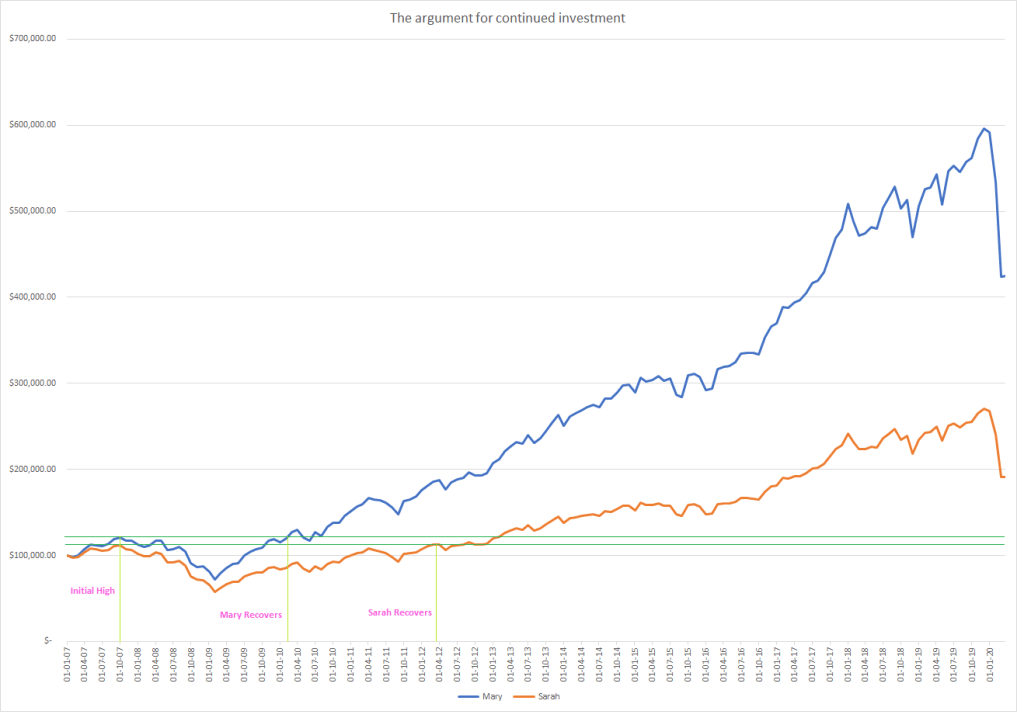
Below is a graph that shows how each scenario would have unfolded. The blue line indicates Mary’s progress and the orange line indicates Sarah’s progress. A few very notable things:
- Both Mary and Sarah’s investments initial peak was on October of 2007 albeit Mary’s peak was slightly higher than Sarah’s
- Both Mary and Sarah’s investments bottomed out February of 2009 (as did 99% of all other investors)
- This is where things become interesting… Mary’s investments recovered to their previous high by January 2010, just slightly over 2 years from it’s peak. Sarah’s investments did not recover until April 2012 a whopping 2 years longer
- Mary’s wealth has more than quadrupled from it’s all time high in 2007, even post the March 2020 downturn.
- Sarah’s wealth has not even doubled in a 13 year span.
Here are the actual numbers of how Mary and Sarah’s wealth has changed over the period:
| Date | Mary | Sarah |
| 01-01-07 | $ 99,963.79 | $ 99,963.79 |
| 01-02-07 | $ 98,271.73 | $ 97,290.23 |
| 01-03-07 | $ 100,070.23 | $ 98,093.54 |
| 01-04-07 | $ 106,854.61 | $ 103,850.14 |
| 01-05-07 | $ 112,564.30 | $ 108,476.01 |
| 01-06-07 | $ 111,827.89 | $ 106,866.70 |
| 01-07-07 | $ 111,244.96 | $ 105,431.68 |
| 01-08-07 | $ 113,540.79 | $ 106,728.34 |
| 01-09-07 | $ 119,224.50 | $ 111,165.04 |
| 01-10-07 | $ 120,633.88 | $ 111,579.38 |
| 01-11-07 | $ 116,868.83 | $ 107,241.19 |
| 01-12-07 | $ 116,995.72 | $ 106,516.51 |
| 01-01-08 | $ 112,588.21 | $ 101,708.90 |
| 01-02-08 | $ 110,274.84 | $ 98,744.44 |
| 01-03-08 | $ 111,347.04 | $ 98,838.89 |
| 01-04-08 | $ 117,432.39 | $ 103,458.45 |
| 01-05-08 | $ 116,778.08 | $ 102,117.63 |
| 01-06-08 | $ 105,895.59 | $ 91,821.58 |
| 01-07-08 | $ 107,180.94 | $ 92,161.96 |
| 01-08-08 | $ 109,783.06 | $ 93,621.52 |
| 01-09-08 | $ 104,274.84 | $ 88,107.36 |
| 01-10-08 | $ 90,639.09 | $ 75,812.33 |
| 01-11-08 | $ 86,877.75 | $ 71,868.39 |
| 01-12-08 | $ 87,412.84 | $ 71,527.58 |
| 01-01-09 | $ 80,728.68 | $ 65,287.02 |
| 01-02-09 | $ 72,324.41 | $ 57,704.14 |
| 01-03-09 | $ 78,980.59 | $ 62,240.96 |
| 01-04-09 | $ 85,846.94 | $ 66,896.90 |
| 01-05-09 | $ 90,358.51 | $ 69,702.71 |
| 01-06-09 | $ 90,805.25 | $ 69,349.87 |
| 01-07-09 | $ 99,603.69 | $ 75,390.64 |
| 01-08-09 | $ 104,174.19 | $ 78,154.39 |
| 01-09-09 | $ 107,612.07 | $ 80,029.19 |
| 01-10-09 | $ 108,685.45 | $ 80,130.03 |
| 01-11-09 | $ 116,793.24 | $ 85,448.38 |
| 01-12-09 | $ 118,775.49 | $ 86,239.97 |
| 01-01-10 | $ 115,673.62 | $ 83,357.49 |
| 01-02-10 | $ 119,669.76 | $ 85,596.40 |
| 01-03-10 | $ 126,914.00 | $ 90,110.03 |
| 01-04-10 | $ 129,791.52 | $ 91,481.55 |
| 01-05-10 | $ 120,625.90 | $ 84,336.76 |
| 01-06-10 | $ 117,483.71 | $ 81,417.58 |
| 01-07-10 | $ 126,847.20 | $ 87,285.94 |
| 01-08-10 | $ 122,480.02 | $ 83,622.91 |
| 01-09-10 | $ 133,016.65 | $ 90,188.10 |
| 01-10-10 | $ 138,091.65 | $ 93,061.76 |
| 01-11-10 | $ 137,905.42 | $ 92,230.44 |
| 01-12-10 | $ 146,108.17 | $ 97,135.31 |
| 01-01-11 | $ 151,265.35 | $ 99,892.21 |
| 01-02-11 | $ 156,741.68 | $ 102,823.52 |
| 01-03-11 | $ 159,170.92 | $ 103,732.13 |
| 01-04-11 | $ 166,665.13 | $ 107,992.85 |
| 01-05-11 | $ 164,664.25 | $ 106,089.03 |
| 01-06-11 | $ 163,869.29 | $ 104,901.17 |
| 01-07-11 | $ 161,505.10 | $ 102,731.81 |
| 01-08-11 | $ 155,621.31 | $ 98,366.60 |
| 01-09-11 | $ 147,439.76 | $ 92,545.46 |
| 01-10-11 | $ 162,707.68 | $ 101,498.03 |
| 01-11-11 | $ 165,146.27 | $ 102,388.28 |
| 01-12-11 | $ 168,724.50 | $ 103,971.43 |
| 01-01-12 | $ 175,597.45 | $ 107,632.39 |
| 01-02-12 | $ 181,199.46 | $ 110,481.16 |
| 01-03-12 | $ 186,025.52 | $ 112,830.82 |
| 01-04-12 | $ 187,237.14 | $ 112,976.54 |
| 01-05-12 | $ 176,854.53 | $ 106,087.93 |
| 01-06-12 | $ 184,958.09 | $ 110,382.37 |
| 01-07-12 | $ 187,975.42 | $ 111,614.47 |
| 01-08-12 | $ 190,340.81 | $ 112,450.31 |
| 01-09-12 | $ 196,585.21 | $ 115,559.32 |
| 01-10-12 | $ 192,779.89 | $ 112,760.52 |
| 01-11-12 | $ 192,908.84 | $ 112,280.50 |
| 01-12-12 | $ 195,251.68 | $ 113,088.73 |
| 01-01-13 | $ 207,770.10 | $ 119,755.41 |
| 01-02-13 | $ 211,941.71 | $ 121,571.34 |
| 01-03-13 | $ 221,010.67 | $ 126,250.16 |
| 01-04-13 | $ 226,158.55 | $ 128,661.06 |
| 01-05-13 | $ 231,570.54 | $ 131,203.15 |
| 01-06-13 | $ 229,607.83 | $ 129,564.42 |
| 01-07-13 | $ 239,932.88 | $ 134,846.00 |
| 01-08-13 | $ 230,448.42 | $ 128,997.80 |
| 01-09-13 | $ 236,628.04 | $ 131,930.72 |
| 01-10-13 | $ 244,379.19 | $ 135,714.40 |
| 01-11-13 | $ 254,165.28 | $ 140,595.22 |
| 01-12-13 | $ 263,237.36 | $ 145,045.78 |
| 01-01-14 | $ 250,553.64 | $ 137,521.92 |
| 01-02-14 | $ 261,800.23 | $ 143,141.40 |
| 01-03-14 | $ 265,297.48 | $ 144,498.26 |
| 01-04-14 | $ 268,609.61 | $ 145,745.58 |
| 01-05-14 | $ 271,988.35 | $ 147,111.10 |
| 01-06-14 | $ 274,946.64 | $ 148,242.34 |
| 01-07-14 | $ 271,969.40 | $ 146,088.31 |
| 01-08-14 | $ 281,953.43 | $ 150,979.31 |
| 01-09-14 | $ 282,230.43 | $ 150,659.24 |
| 01-10-14 | $ 289,204.34 | $ 153,906.10 |
| 01-11-14 | $ 297,731.61 | $ 157,958.21 |
| 01-12-14 | $ 298,892.89 | $ 158,090.63 |
| 01-01-15 | $ 289,057.74 | $ 152,424.75 |
| 01-02-15 | $ 306,623.94 | $ 161,199.70 |
| 01-03-15 | $ 301,838.50 | $ 158,207.46 |
| 01-04-15 | $ 304,180.86 | $ 158,959.03 |
| 01-05-15 | $ 308,342.84 | $ 160,655.26 |
| 01-06-15 | $ 302,879.37 | $ 157,342.22 |
| 01-07-15 | $ 305,326.97 | $ 158,147.34 |
| 01-08-15 | $ 286,761.31 | $ 147,925.86 |
| 01-09-15 | $ 283,842.32 | $ 145,910.91 |
| 01-10-15 | $ 309,111.93 | $ 158,441.95 |
| 01-11-15 | $ 311,338.99 | $ 159,124.88 |
| 01-12-15 | $ 307,377.52 | $ 156,651.01 |
| 01-01-16 | $ 291,947.51 | $ 148,196.71 |
| 01-02-16 | $ 294,158.87 | $ 148,813.67 |
| 01-03-16 | $ 316,209.41 | $ 159,519.51 |
| 01-04-16 | $ 319,036.85 | $ 160,495.97 |
| 01-05-16 | $ 320,525.33 | $ 160,796.28 |
| 01-06-16 | $ 324,353.52 | $ 162,266.41 |
| 01-07-16 | $ 334,729.48 | $ 166,996.10 |
| 01-08-16 | $ 335,632.07 | $ 166,895.99 |
| 01-09-16 | $ 335,405.32 | $ 166,238.01 |
| 01-10-16 | $ 333,820.53 | $ 164,914.60 |
| 01-11-16 | $ 353,212.52 | $ 174,024.58 |
| 01-12-16 | $ 366,398.60 | $ 180,037.28 |
| 01-01-17 | $ 369,869.35 | $ 181,160.50 |
| 01-02-17 | $ 388,772.65 | $ 190,015.75 |
| 01-03-17 | $ 387,435.39 | $ 188,861.84 |
| 01-04-17 | $ 394,100.39 | $ 191,605.66 |
| 01-05-17 | $ 396,853.41 | $ 192,439.24 |
| 01-06-17 | $ 404,789.00 | $ 195,776.11 |
| 01-07-17 | $ 416,588.00 | $ 200,960.47 |
| 01-08-17 | $ 419,208.70 | $ 201,703.04 |
| 01-09-17 | $ 429,505.57 | $ 206,126.83 |
| 01-10-17 | $ 449,778.10 | $ 215,304.38 |
| 01-11-17 | $ 468,699.07 | $ 223,791.06 |
| 01-12-17 | $ 479,058.50 | $ 228,158.41 |
| 01-01-18 | $ 508,344.15 | $ 241,620.37 |
| 01-02-18 | $ 488,069.38 | $ 231,520.09 |
| 01-03-18 | $ 471,697.85 | $ 223,194.79 |
| 01-04-18 | $ 474,564.27 | $ 223,992.40 |
| 01-05-18 | $ 481,236.20 | $ 226,578.99 |
| 01-06-18 | $ 480,088.49 | $ 225,481.40 |
| 01-07-18 | $ 504,237.36 | $ 236,361.26 |
| 01-08-18 | $ 516,699.92 | $ 241,732.48 |
| 01-09-18 | $ 528,107.88 | $ 246,591.45 |
| 01-10-18 | $ 502,817.51 | $ 234,330.04 |
| 01-11-18 | $ 512,812.30 | $ 238,529.23 |
| 01-12-18 | $ 470,048.34 | $ 218,111.76 |
| 01-01-19 | $ 505,493.33 | $ 233,996.91 |
| 01-02-19 | $ 525,576.48 | $ 242,832.92 |
| 01-03-19 | $ 527,389.34 | $ 243,211.02 |
| 01-04-19 | $ 542,495.37 | $ 249,707.43 |
| 01-05-19 | $ 507,963.85 | $ 233,261.37 |
| 01-06-19 | $ 546,097.20 | $ 250,305.63 |
| 01-07-19 | $ 553,135.31 | $ 253,061.42 |
| 01-08-19 | $ 545,227.72 | $ 248,982.92 |
| 01-09-19 | $ 557,447.55 | $ 254,094.88 |
| 01-10-19 | $ 561,750.21 | $ 255,586.88 |
| 01-11-19 | $ 584,310.87 | $ 265,366.34 |
| 01-12-19 | $ 596,168.00 | $ 270,259.02 |
| 01-01-20 | $ 591,963.81 | $ 267,867.16 |
| 01-02-20 | $ 533,850.64 | $ 241,134.82 |
| 01-03-20 | $ 423,638.83 | $ 191,029.17 |
| 19-03-20 | $ 425,044.93 | $ 191,230.04 |
The moral of this anecdote is this. When the global financial crisis occurred majority of people who had their money invested in the stock market were very pessimistic on the future of the stock market. Many pulled their money out in fear. Those who had the mental tenacity to regard the situation as temporary and that the validity of the American economy would not go to naught and continued to invest benefit greatly from their consistency. No one knows what tomorrow will bring but all else being equal the economy will return to it’s prior levels and excel beyond those if you are patient and consistent.
I am writing this in the mid of the COVID-19 pandemic that has caused our financial markets to go belly-up so I (and no one else for that matter) can say where it is going to bottom out but if this illustration has shown us anything it does not matter.If you are able to continue investing, even minimal amounts you will be rewarded. Fortune favours the brave!
Happy investing all, stay healthy and safe.
-FF

Leave a comment